
Dogecoin’s Price Coils In A Key Bullish Chart Pattern, A Rebound On The Horizon?


During the recent bullish market action in late April, Dogecoin witnessed a notable upward movement, rising to the $0.18 mark with robust momentum and volume. However, the dog-themed meme coin seems to have lost its steam as it pulls back to key support levels, but technical developments are pointing to a potential rebound in the short term.
Chart Pattern To Spark A Rally For Dogecoin?
In the past few days, Dogecoin’s price has faced bearish pressure, causing it to revisit the $0.16 support level. After enduring a phase of price correction and diminishing upside momentum, DOGE is currently displaying a possible reversal signal.
Trader Tardigrade, a crypto analyst and investor, has pointed out a positive trend in the Dogecoin chart that suggests a shift in price dynamics. Following his examination of the 1-day time frame chart, Trader Tardigrade unveiled a critical pattern, particularly the Diamond Bottom Reversal Formation.
The emergence of this bullish pattern indicates that the ongoing DOGE correction is nearing its end. Looking at the chart, the meme coin previously tested the upper line of the pattern and failed, leading to a slight pullback. However, when a breakout finally occurs, the crypto expert has predicted a sharp rally to the $0.35 price level.
A Diamond Bottom Reversal Formation is often called a bullish diamond pattern, which hints at a potential shift to an upward trend after a prolonged period of downward trend. It is distinguished by a symmetrical diamond-shaped pattern created by trendlines that converge, usually following a persistently negative activity.
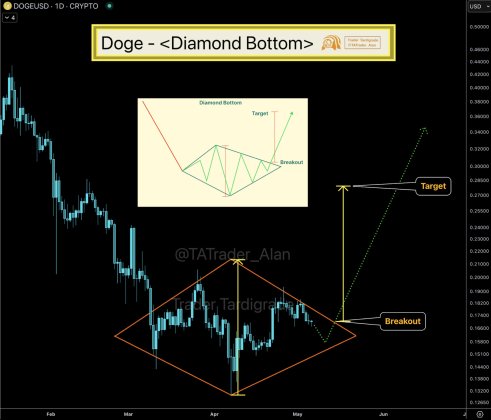
Since the diamond bottom formation implies a change in price toward the upside trajectory, it shows DOGE may be building momentum for another move. Thus, this key chart pattern could pave the way for a bounce to higher levels in the near term.
In another technical analysis, Trader Tradigrade reported that crucial momentum indicators are flashing upward signals despite the current correction. One of these indicators is the Dogecoin Price Momentum Oscillator (PMO), which measures the rate of change in a price over a specific period. It helps to determine trend reversals or overbought/oversold conditions.
Trader Tardigrade highlighted an impending bullish crossover in the PMO indicator, “turning into green time.” A change in the PMO indicator to green time suggests a phase of positive price movements for DOGE.
DOGE To Trigger A Meme Coin Frenzy
Despite ongoing corrections, optimism in Dogecoin remains strong in the community. Kamran Ashgar, a crypto trader, highlighted that DOGE is waking up, building strength for a price recovery as indicated by the Relative Strength Index (RSI).
When DOGE makes a bullish move, the analyst believes that other meme coins could follow suit, sparking a memecoin mania. His prediction is based on a 28-day trend, which suggests that the meme coin is about to break out of the trend. According to Ashgar, “this is not just a breakout, it is a signal” of upside movements.

Featured image from Getty Images, chart from Tradingview.com

Editorial Process for bitcoinist is centered on delivering thoroughly researched, accurate, and unbiased content. We uphold strict sourcing standards, and each page undergoes diligent review by our team of top technology experts and seasoned editors. This process ensures the integrity, relevance, and value of our content for our readers.