
Bitcoin To $150,000? Crypto Expert Identifies Pattern That Could Define Next Leg Up


After an uninspiring start to the month of June, Bitcoin investors have been left wondering what’s next for the world’s largest cryptocurrency. Interestingly, crypto analysts have always been a guiding light whenever there is uncertainty as to the premier cryptocurrency’s next direction. As such, a prominent market expert has come forward with an exciting projection for the Bitcoin price.
How Bitcoin Price Could Run Up To $150,000
In a recent post on the X platform, Chartered Market Technician Tony Severino put forward an interesting analysis of the Bitcoin price. According to the crypto market expert, the price of BTC could travel as high as the $150,000 mark in its next bullish phase.
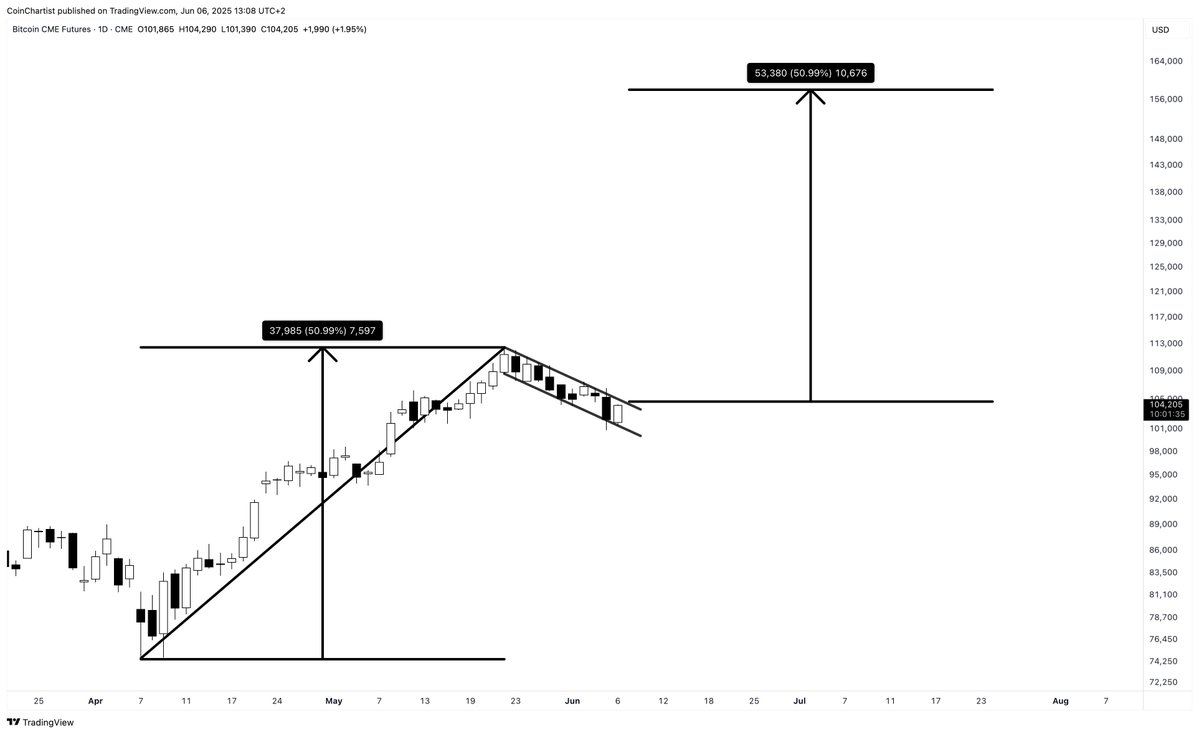
The reasoning behind this bullish projection is the formation of a bull flag pattern on the daily timeframe of the Bitcoin price chart. The bull flag is a technical analysis pattern characterized by a period of steep upward movement (the flagpole) typically followed by sideways or slightly downward price action.
The bull flag is typically considered a prevailing continuation pattern for an existing upward trend, suggesting a potential move to a higher price point. However, it is critical to wait for a successful break out of the consolidation before ascertaining that the price will continue in its upward trajectory.
Source: @TonyTheBullCMT on X
According to Severino, the Bitcoin price could well be on its way to a new all-time high if this bull flag is valid and the price successfully breaks out of the pattern. The target for this chart pattern is usually determined by adding the vertical height of the flagpole to the potential breakout point from the flag.
What Other Indicators Are Saying
Severino highlighted another indicator and explained what it is currently saying for Bitcoin’s next leg up. For instance, the crypto expert mentioned that the Bollinger Bands are squeezing, meaning that while there is currently low market volatility, a significant price movement could be on the horizon.
Severino also mentioned that the Bitcoin price failed to reach the lower band of the Bollinger Band indicator, which could be a “Head Fake” before the flagship cryptocurrency embarks on a fresh upward run. However, investors might want to watch out for a close above the $111,000 level on the daily timeframe to confirm a potential sustained uptrend.
A close beneath the lower band, which sits just beneath the $101,000 mark, could suggest downside action for the Bitcoin price. As of this writing, the price of BTC stands above $105,000, reflecting an almost 2% increase in the past 24 hours.

The price of BTC on the daily timeframe | Source: BTCUSDT chart on TradingView
Featured image from iStock, chart from TradingView

Editorial Process for bitcoinist is centered on delivering thoroughly researched, accurate, and unbiased content. We uphold strict sourcing standards, and each page undergoes diligent review by our team of top technology experts and seasoned editors. This process ensures the integrity, relevance, and value of our content for our readers.