
HBAR Price Charts Spook Traders – Is Bullishness Fading?


HBAR has recently experienced a decline in price, as traders’ optimism fades, marking a shift towards bearish sentiment.
This downward trend, combined with fading bullish signals, suggests that the altcoin may be heading for a more prolonged period of price declines.
HBAR Traders Are Uncertain
In the past 10 days, HBAR’s funding rate has seen two shifts from positive to negative, the first occurrence in a month. This change in sentiment signals that traders are adjusting their positions, favoring short positions over long ones.
The increasing dominance of shorts indicates that market participants are betting on a further price drop. This shift suggests a loss of confidence among traders, who now expect a decline in HBAR’s value.
From a macro perspective, HBAR’s technical indicators have also taken a bearish turn. The Relative Strength Index (RSI), which slipped into the bearish zone towards the end of May, reached its lowest point in two months this week.
The dip in the RSI is a strong indication that HBAR is facing growing selling pressure. As momentum weakens, the likelihood of continued declines in the price of HBAR increases.
This technical signal, coupled with the negative funding rate, suggests that HBAR may continue to struggle in the near term, with the potential for further downside if current conditions persist.

HBAR Price Needs To Pick A Direction
Currently, HBAR is priced at $0.168, just under the resistance of $0.172. Given the mixed market sentiment, which combines bearish indicators and fading bullishness, a decline in price seems likely.
The resistance level at $0.172 remains a significant barrier for HBAR, and failure to break through this level could lead to further price weakness.
If the $0.163 support level fails to hold, HBAR could experience a further decline, possibly reaching $0.154. This drop would extend the current losses and could signal a deeper bearish trend, prompting more traders to reconsider their positions and further fueling the downtrend.
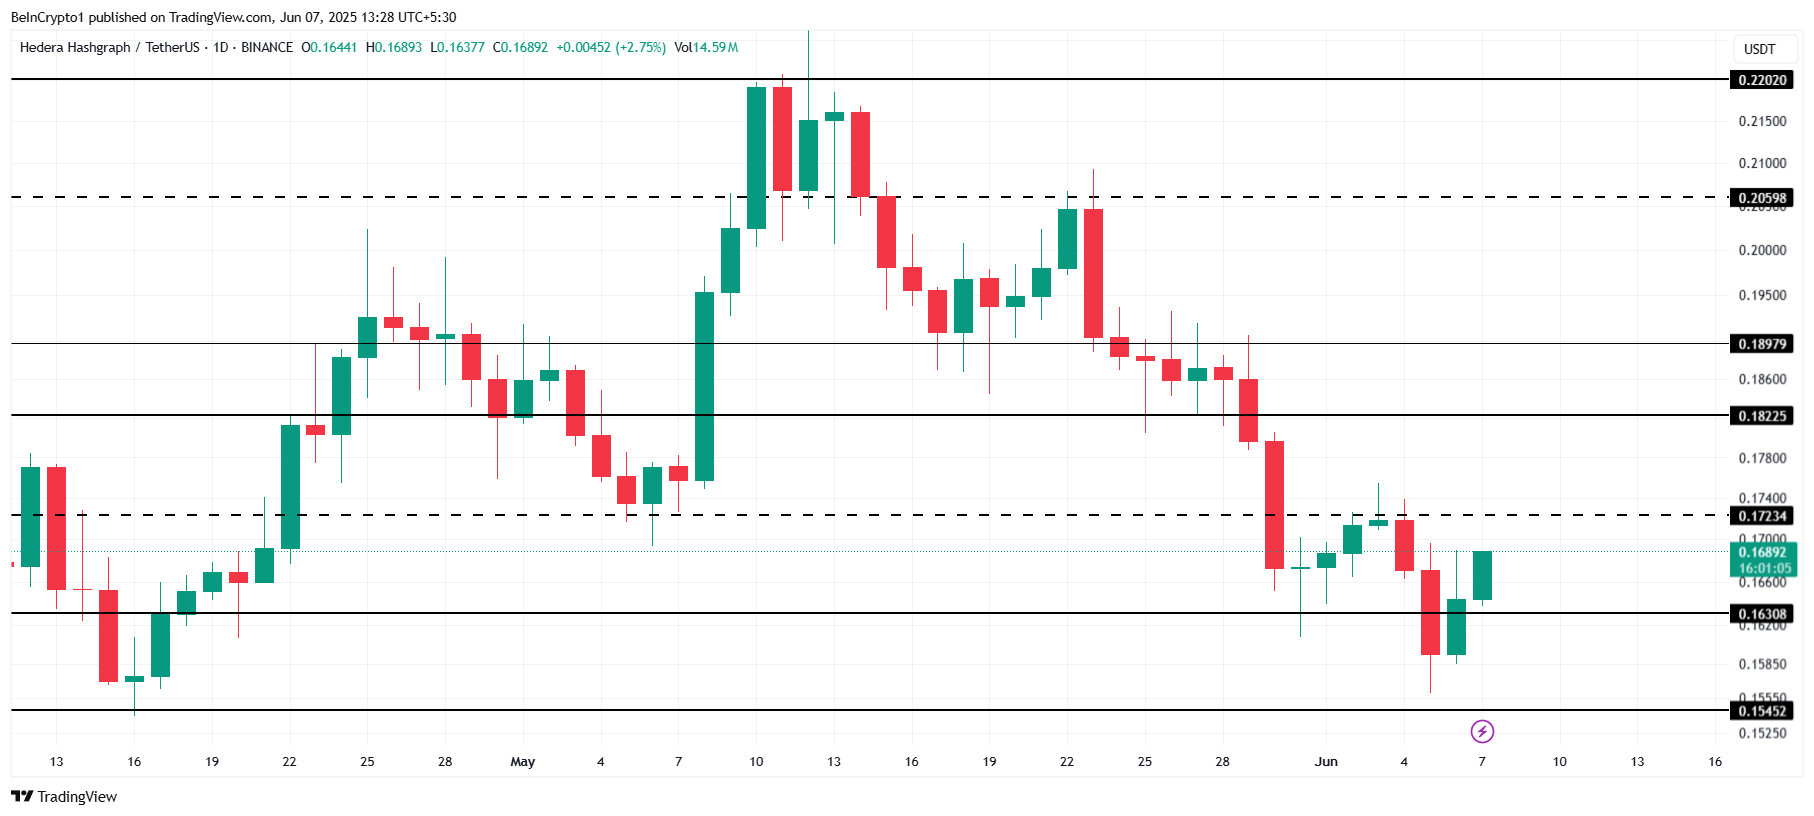
However, if HBAR manages to break past the $0.172 resistance level, it could push toward the next resistance at $0.182.
A successful breach of this level would likely instill confidence among traders and investors, reversing the current bearish sentiment and invalidating the negative outlook for HBAR.
Disclaimer
In line with the Trust Project guidelines, this price analysis article is for informational purposes only and should not be considered financial or investment advice. BeInCrypto is committed to accurate, unbiased reporting, but market conditions are subject to change without notice. Always conduct your own research and consult with a professional before making any financial decisions. Please note that our Terms and Conditions, Privacy Policy, and Disclaimers have been updated.